Selected Projects
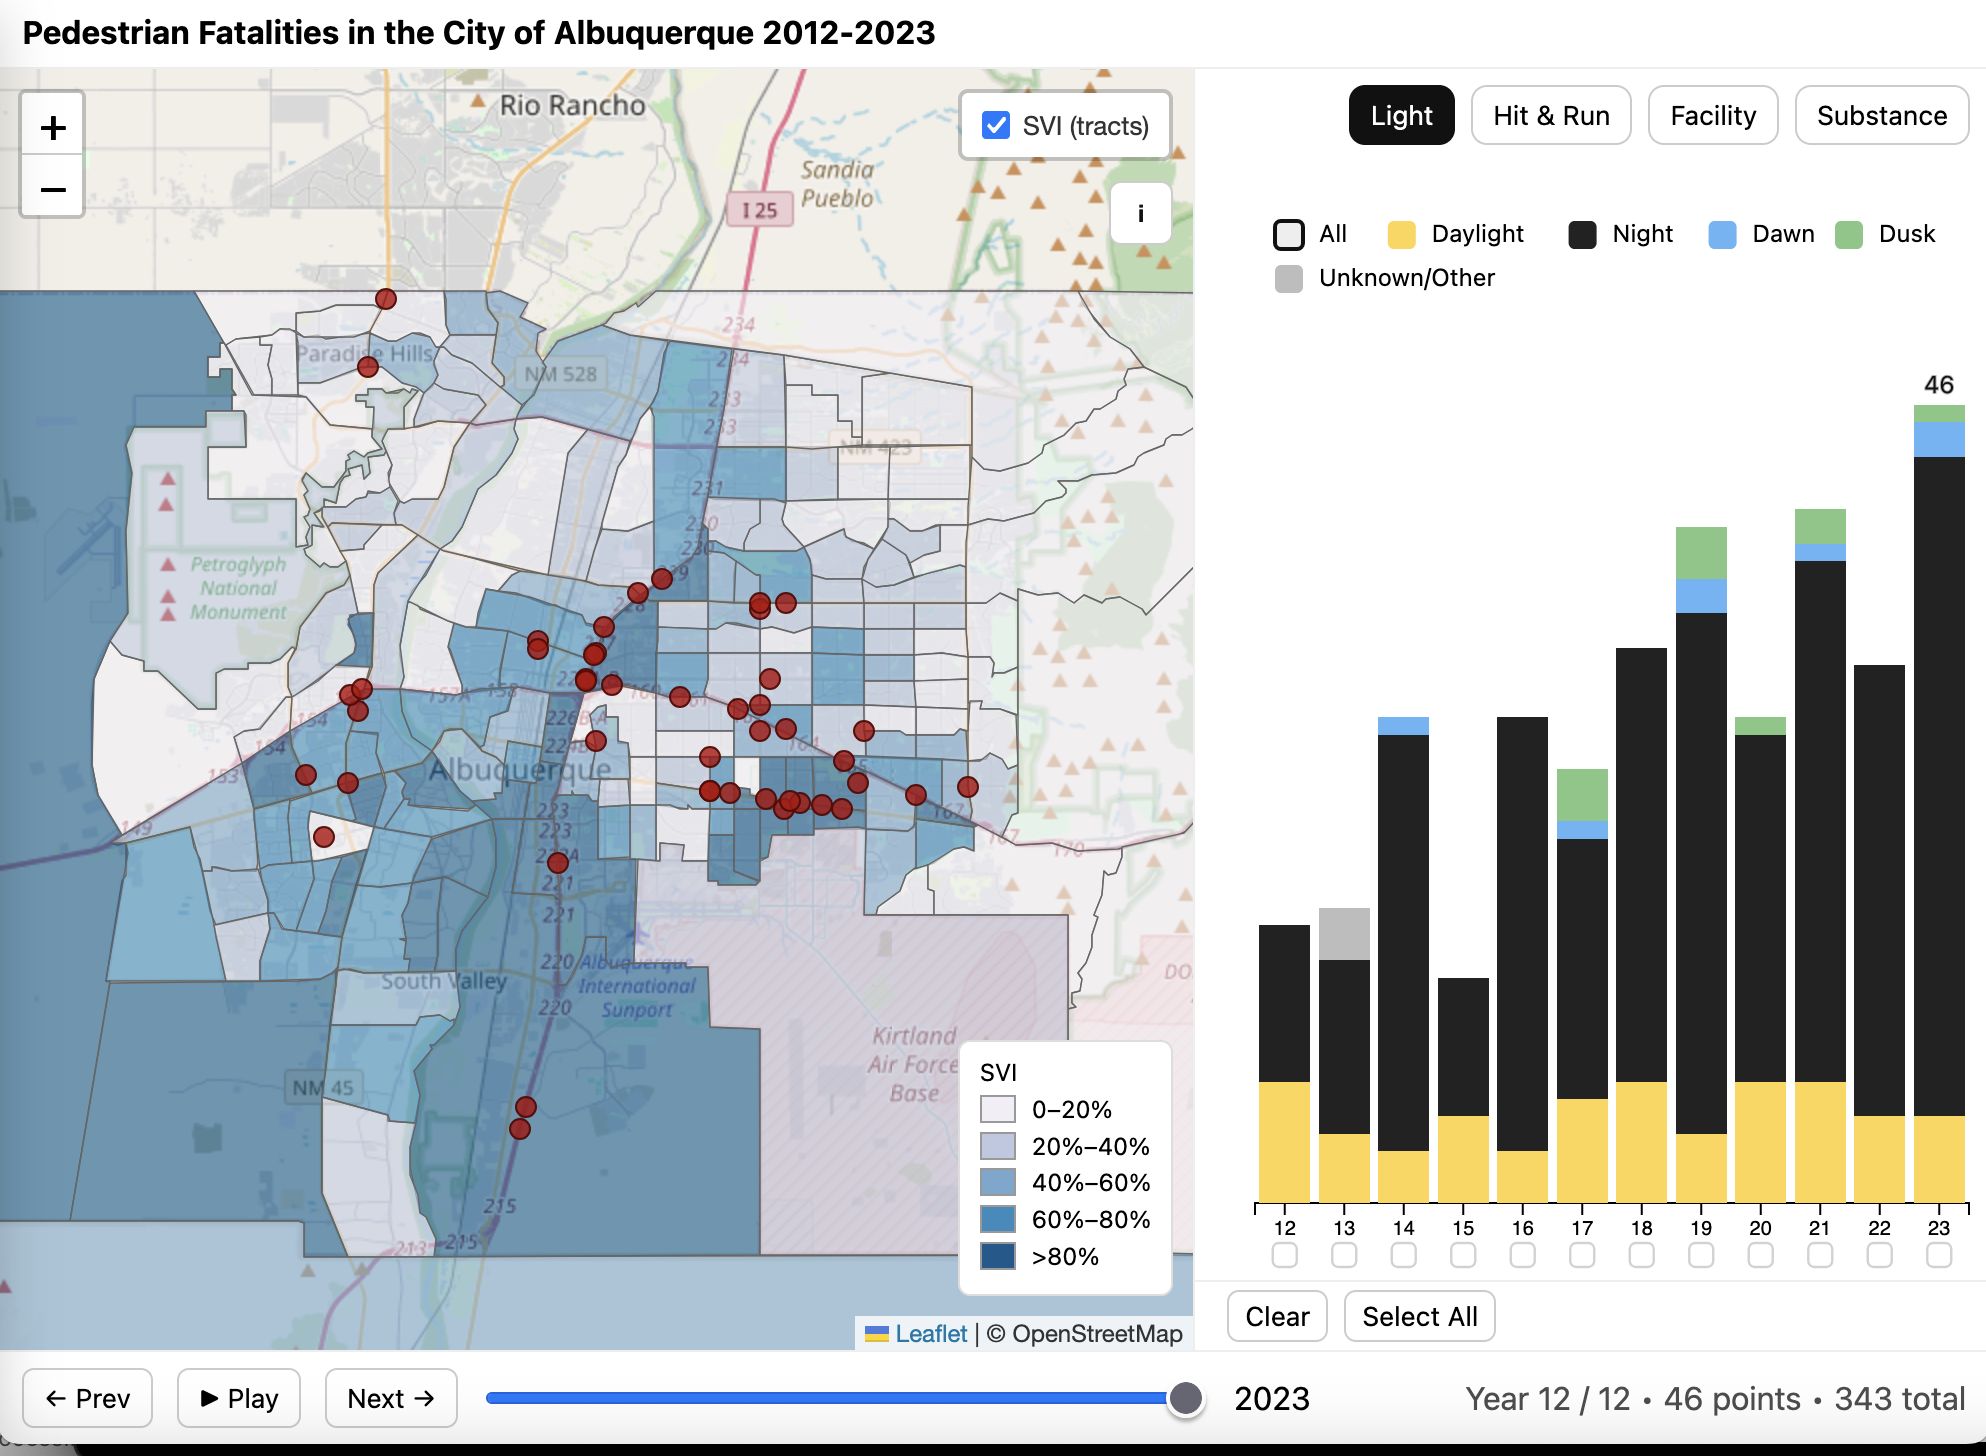
Pedestrian Fatalities in the City of Albuquerque 2012-2023: An interactive Leaflet.js map that allows users to explore the worsening issue of pedestrian deaths on Albuquerque streets over the most recent 12 years of available data.
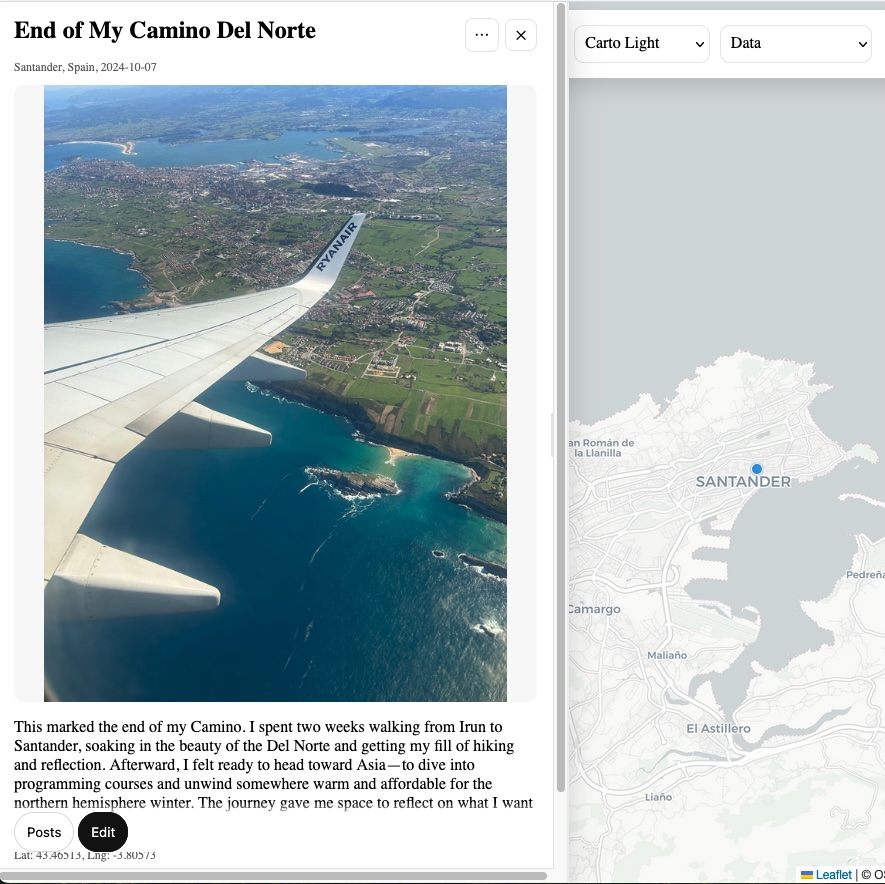
Map Blog (BETA): An interactive Leaflet.js app that lets users place markers, write narratives about their experiences, and add photos for each location. Designed to make it easy to share travel stories with friends and family. Map Blog has no server yet! Your posts are saved to this device (localStorage). Export/Import JSON to move or back up your data.
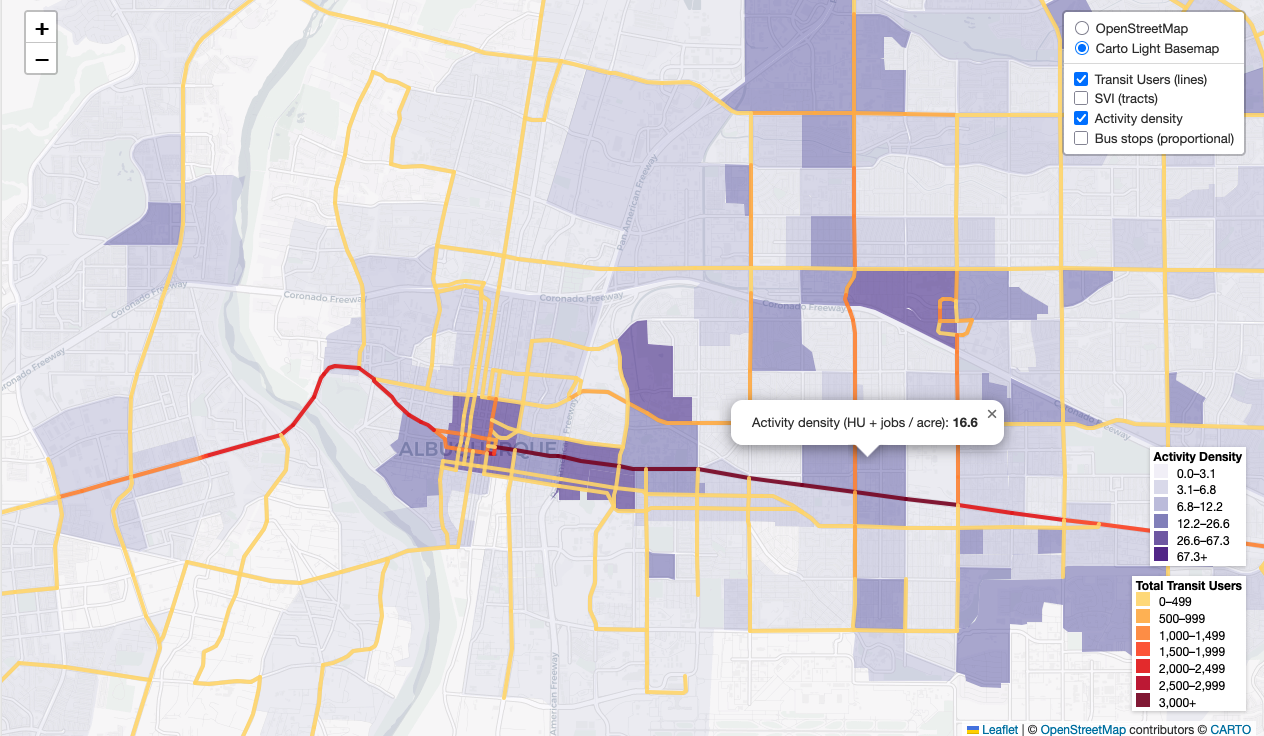
Transit, Vulnerability & Activity Map: An interactive Leaflet.js map exploring Albuquerque’s transit use alongside social vulnerability and activity density. Includes narrative sidebar and togglable layers.
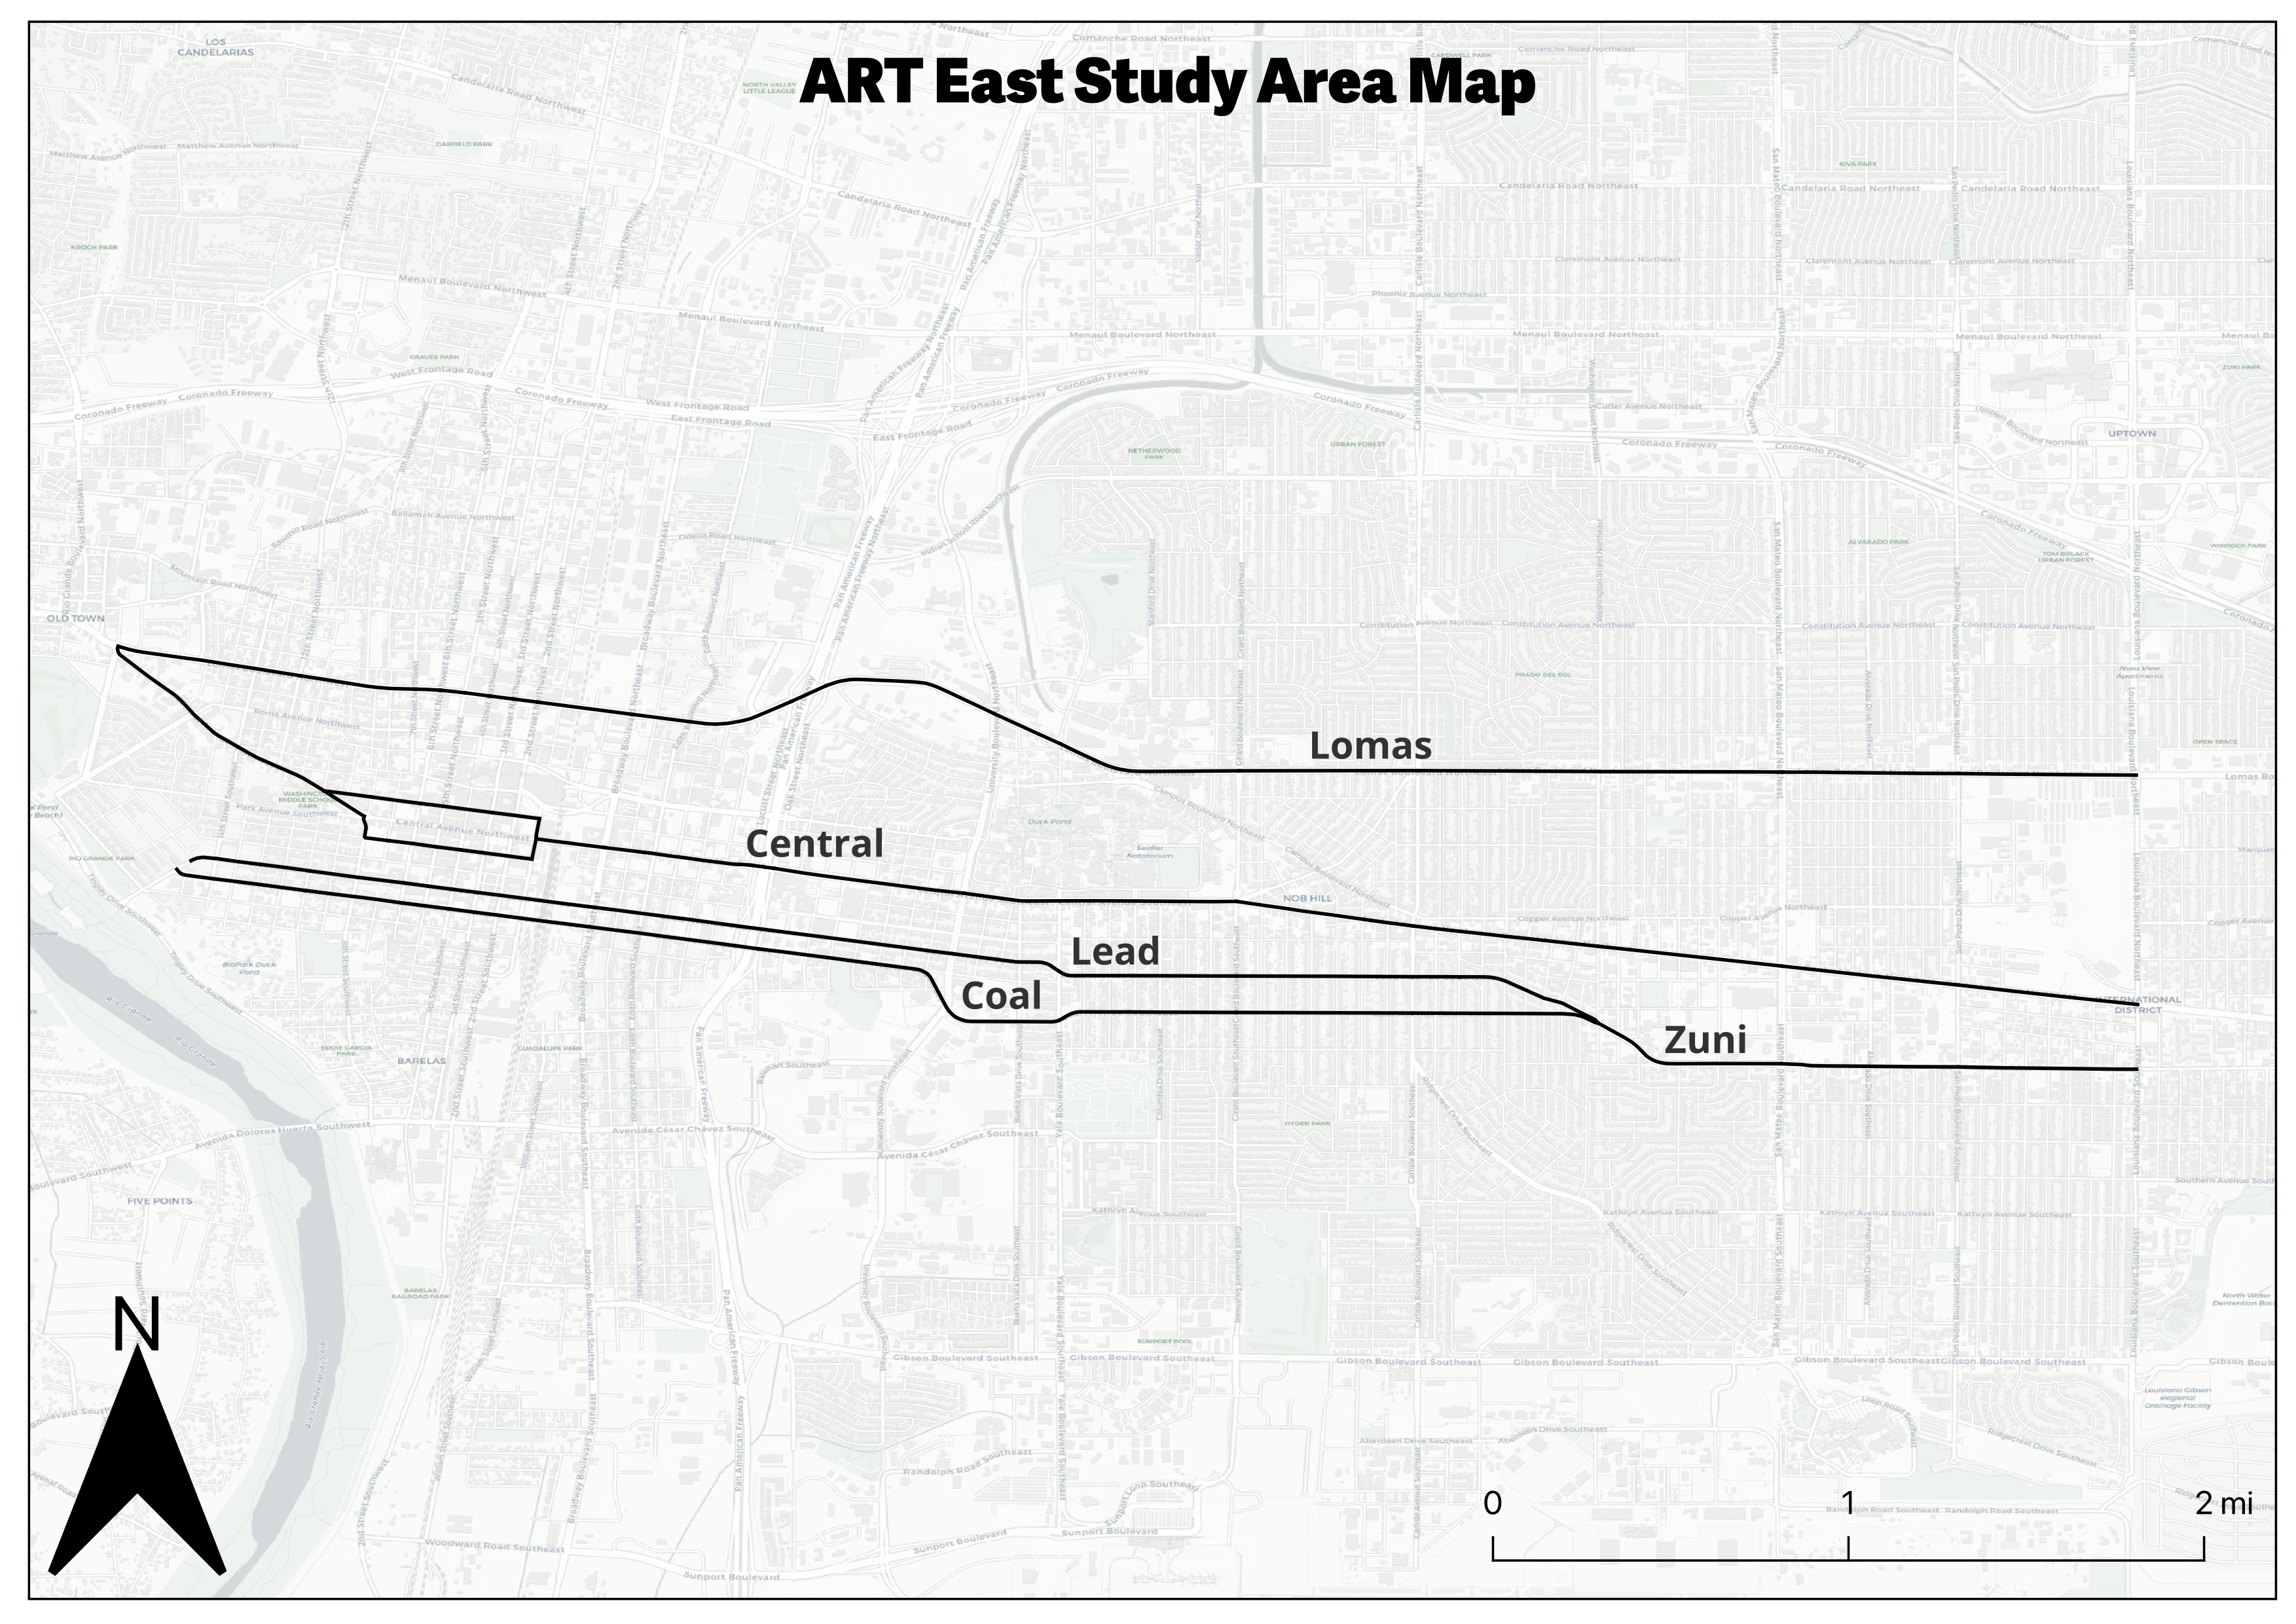
ART Before and After: A visual and data-driven look at how traffic volumes changed after the constructino of the Albuquerque Rapid Transit (ART) project. Includes interactive map and analysis.
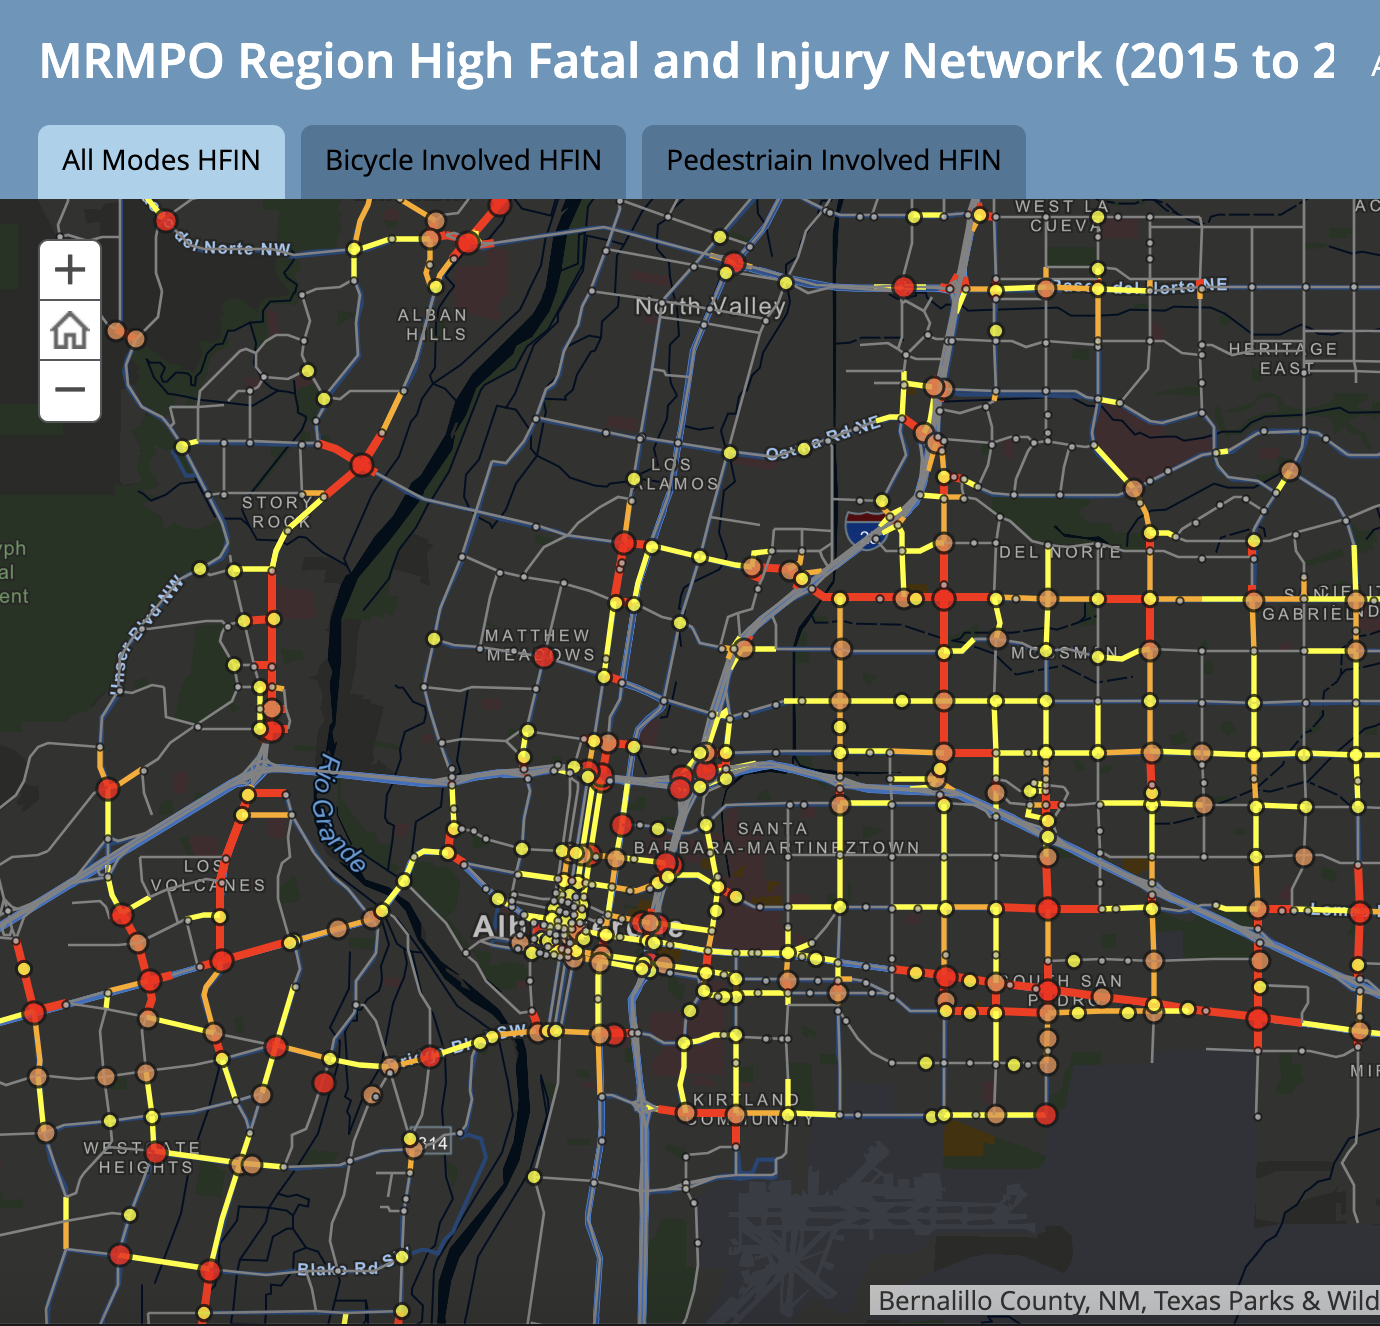
2015-2019 MRCOG Safety Report: Safety report for the Albuquerque Region to be published only as an interactive online map.
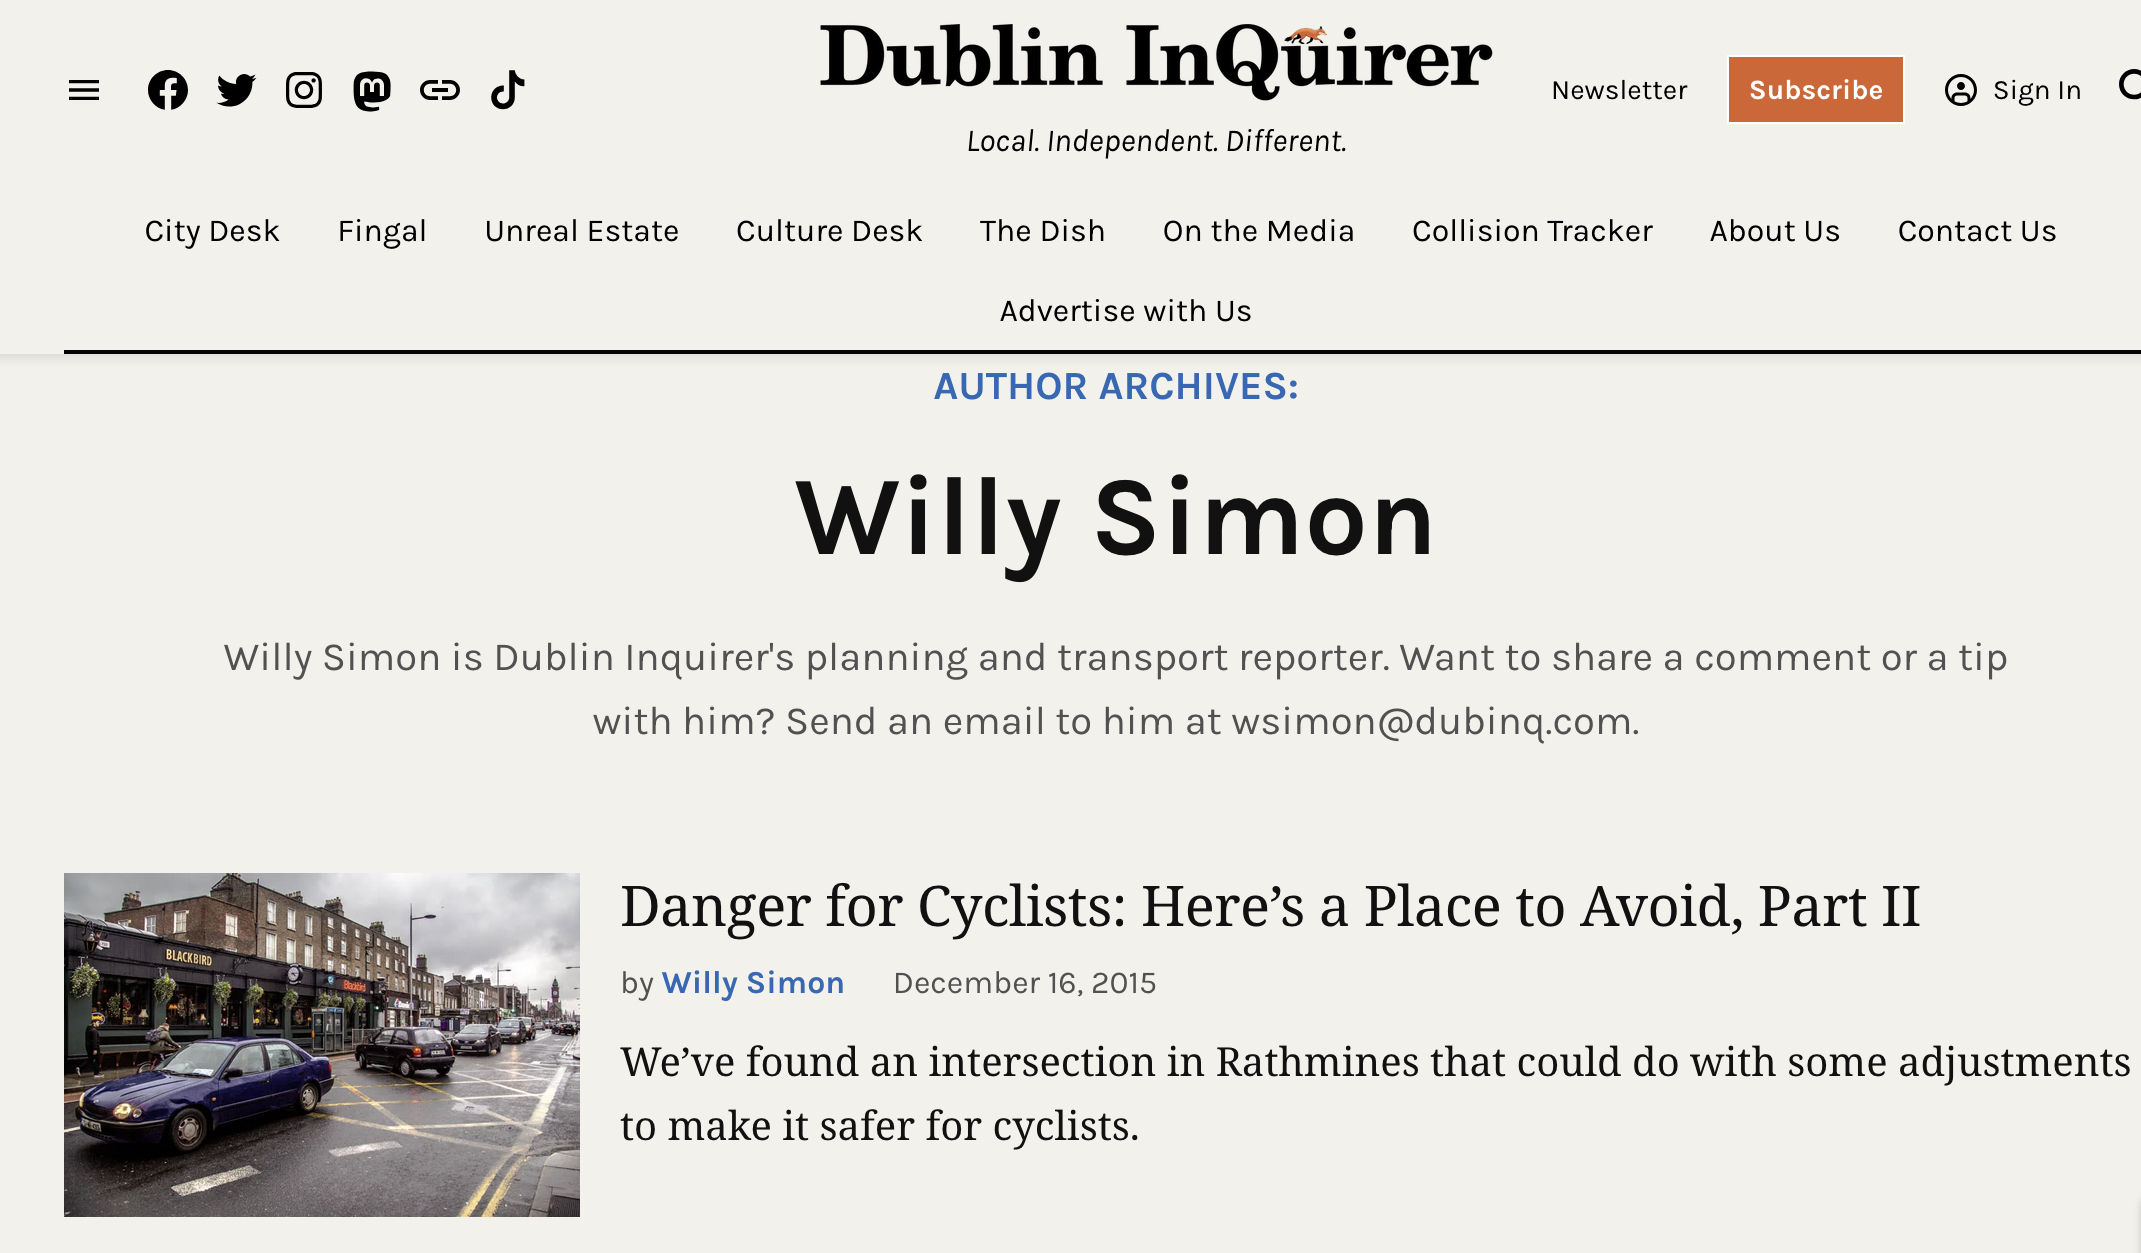
Dublin Inquirer Articles: The articles I authored mostly cover the issues of transportation and urbanism within the city of Dublin, Ireland.
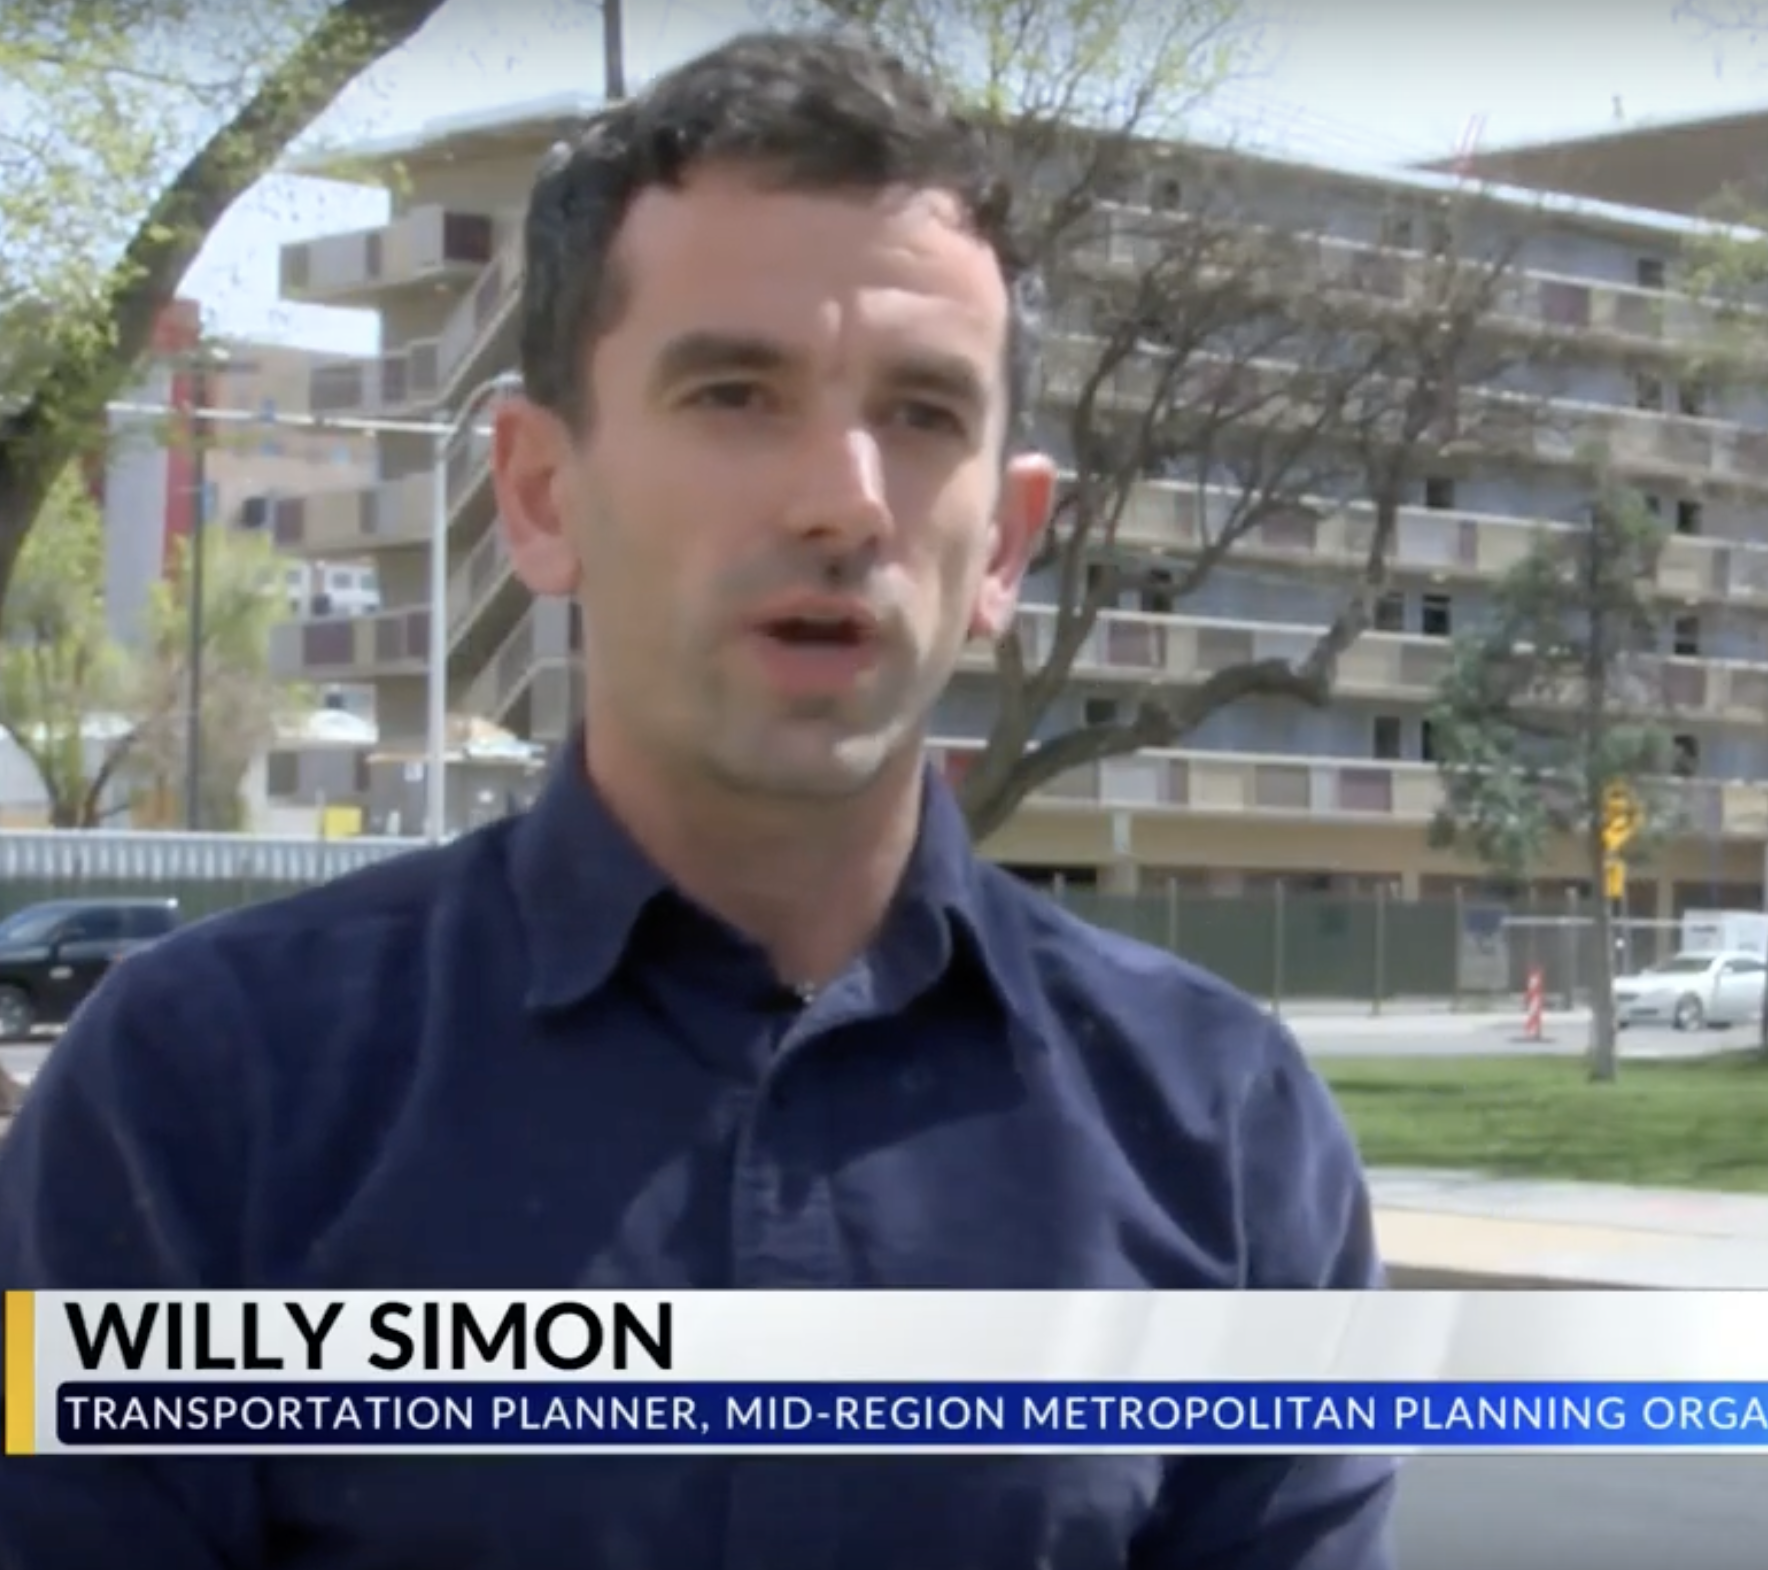
KRQE Interview: In my final media appearance as a transportation planner at MRCOG, I discussed key trends from the 2022 crash data I analyzed. This segment, filmed in March 2024, highlights my work translating technical findings into public insight.
Additional Projects (Learning Journey)
I’m currently improving my JavaScript and web development skills. Below are small projects I’ve created while learning new technologies such as JavaScript and Leaflet.js.